Raspberry Pi Drum Pad
Real Time Embedded Programming Project - Team 1
Project Brief
Our project is to make a drum pad and view how hard it has been hit. There are two sensors, and the code can switch between reading the value from each sensor. An ADC board has been constructed to convert the analogue signals from the drum pad and convert these to digital signals that can be read by a Raspberry Pi. The RPi then plots these data values on a graph.
Constructing the ADC board
As the Raspberry Pi has no dedicated analogue input, an ADC board was designed that could be used as a plug-in to the GPIO pins on the development board. The ADC used for this project was an AD7705 -- a sigma delta converter.
List of Components
- 1x: AD7705 Sigma Delta Convertor
- 1x: 16-pin BDM header
- 4x: 22 Ohm Resistor
- 2x: 1uF tantalum Capacitor
- 1x: 0.1uF Capacitor
- 1x: MCP1525 Microchip Voltage Reference
- 1x: 26 on GPIO header
Schematic
The schematic for the ADC board is available here.
Hardware - Constructing the Drum Pad
Materials
List of materials:
- 2x: 50mm Piezo elements
- 1x: 1000 x 75 x 25mm MDF
- 2x: 75 x 75 x 25mm MDF
- 2x: 10k Resistor
- 2x: 100k Resistor
- 2x: small section of veroboard
- 2x: 4-pin BDM header
Piezo sensors position
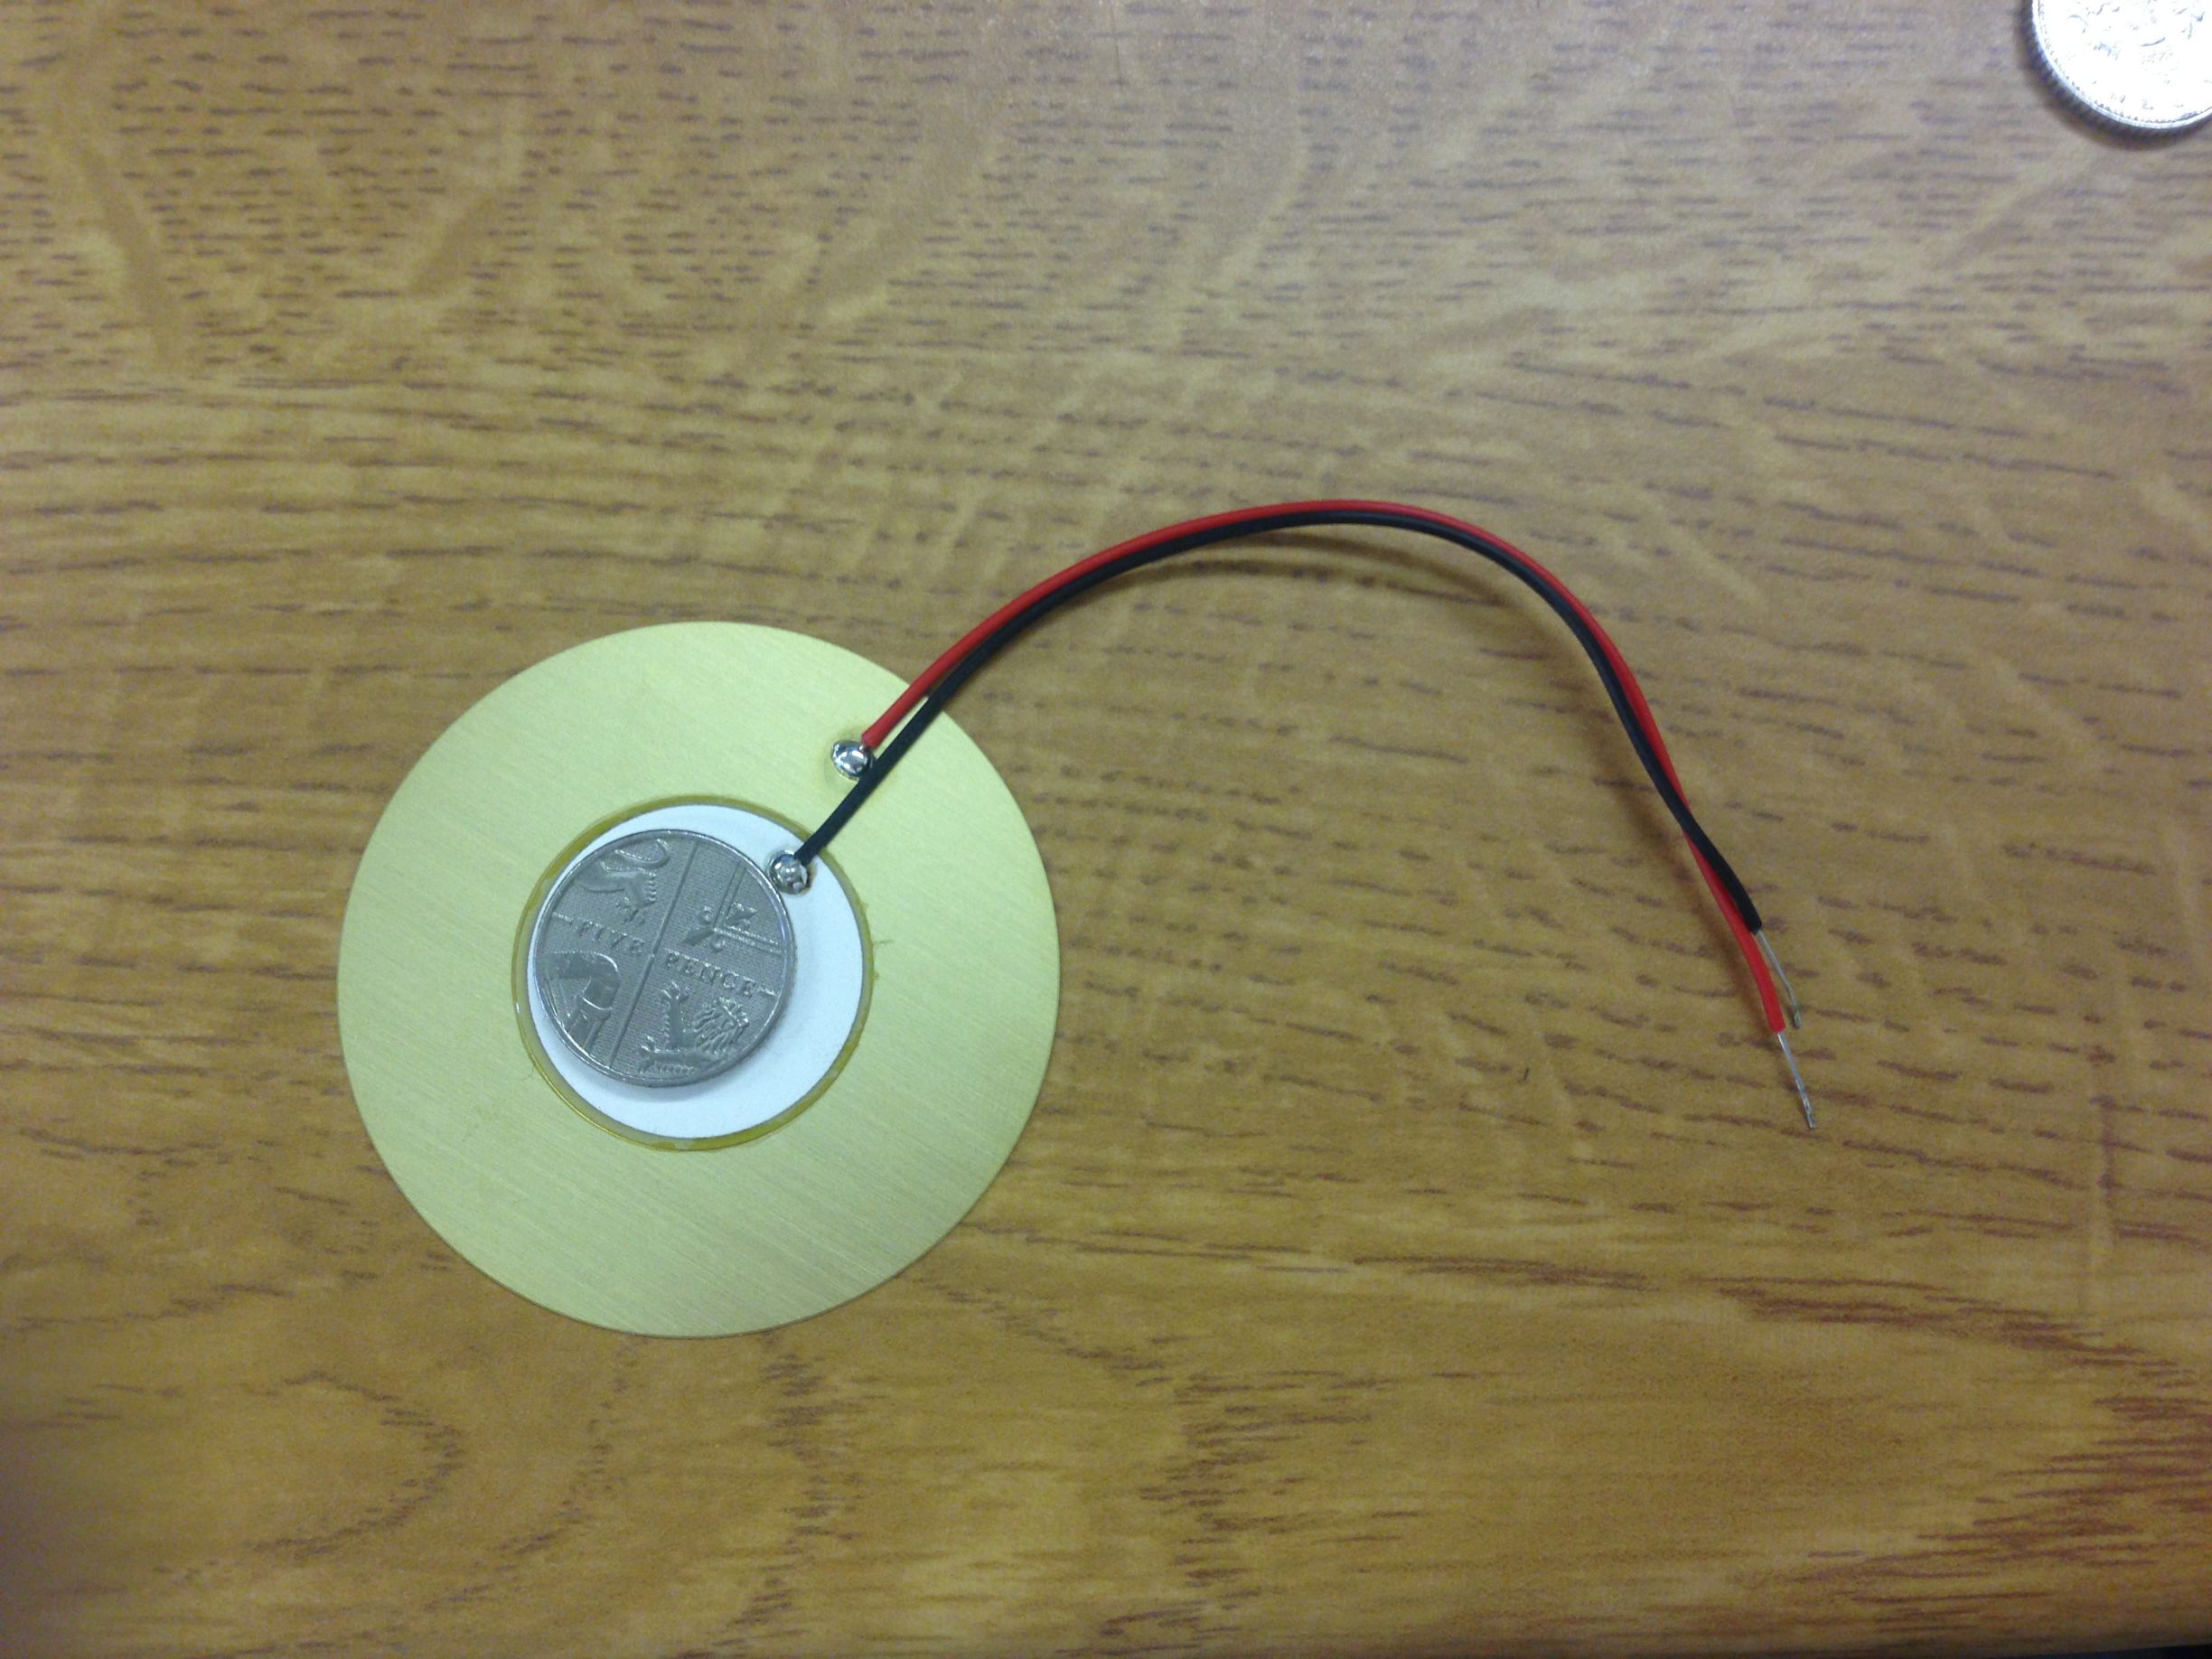
A sensor is placed at either end of the longest piece of MDF. A piezo detects the change in pressure between the centre of the sensor (illustrated in white) and the ground. A five pence piece was attached to the centre in order to focus all pressure on the centre.
 |
| Sensor with 5p attached |
Building the pad
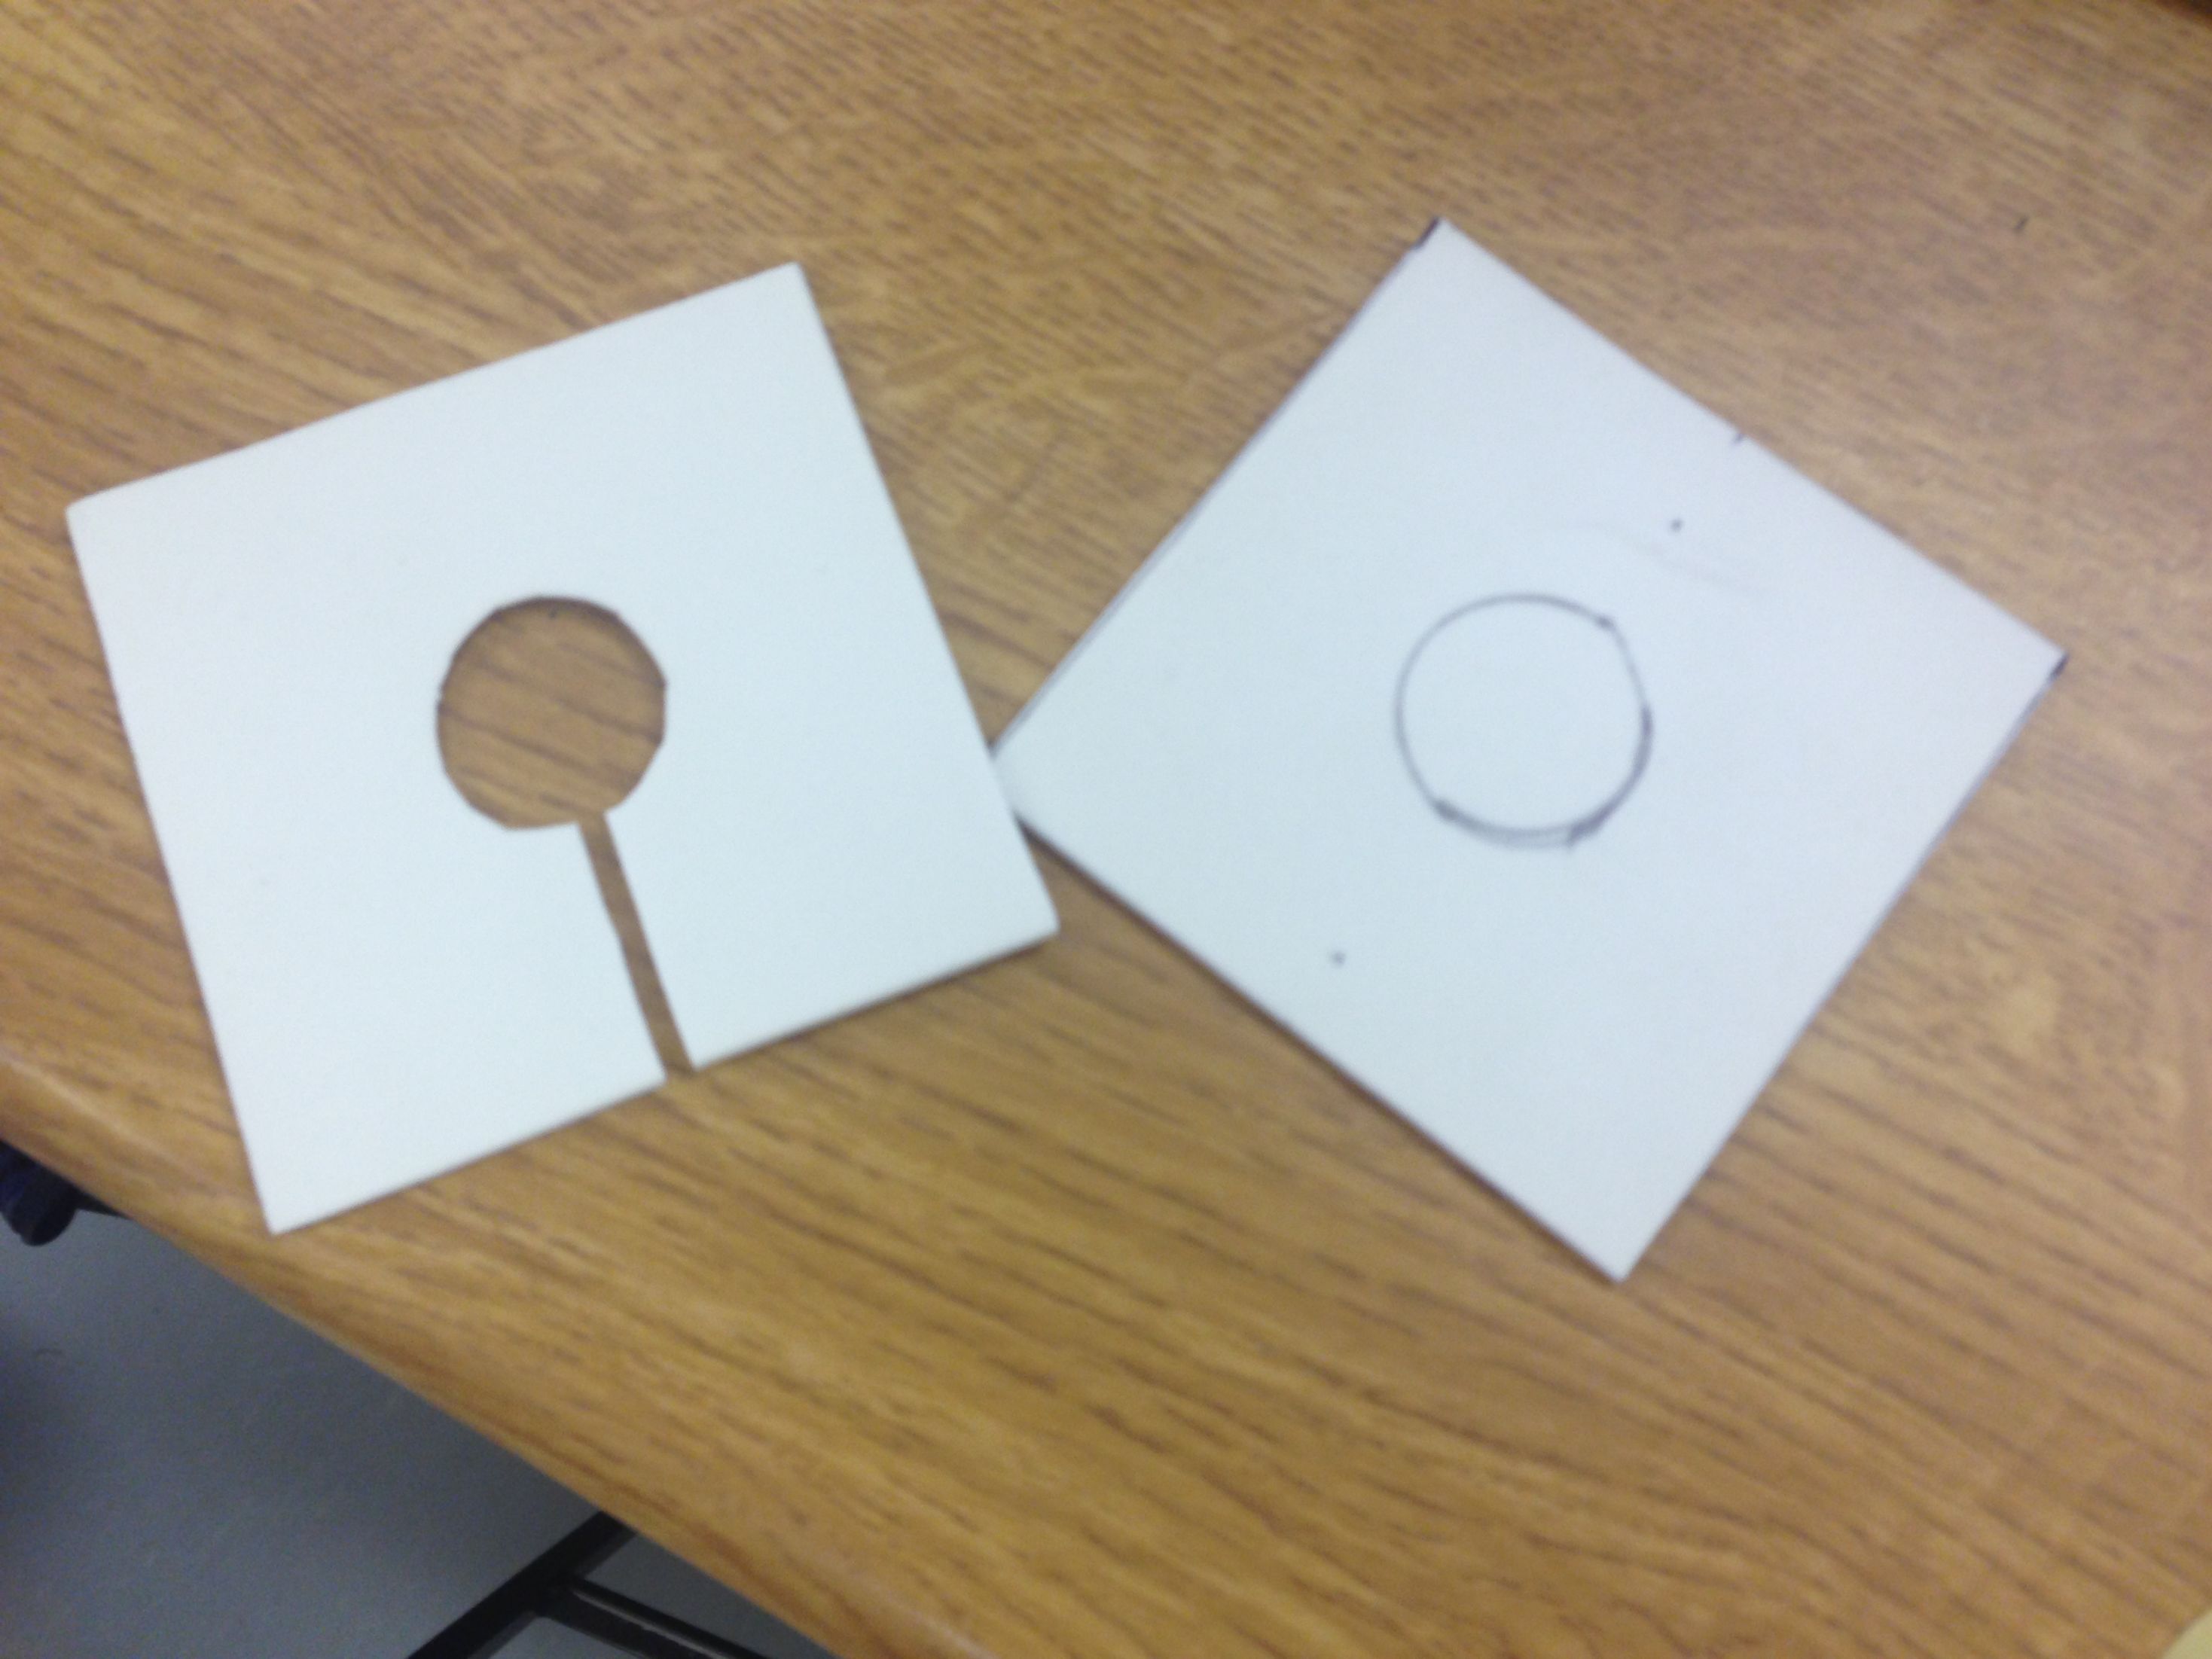
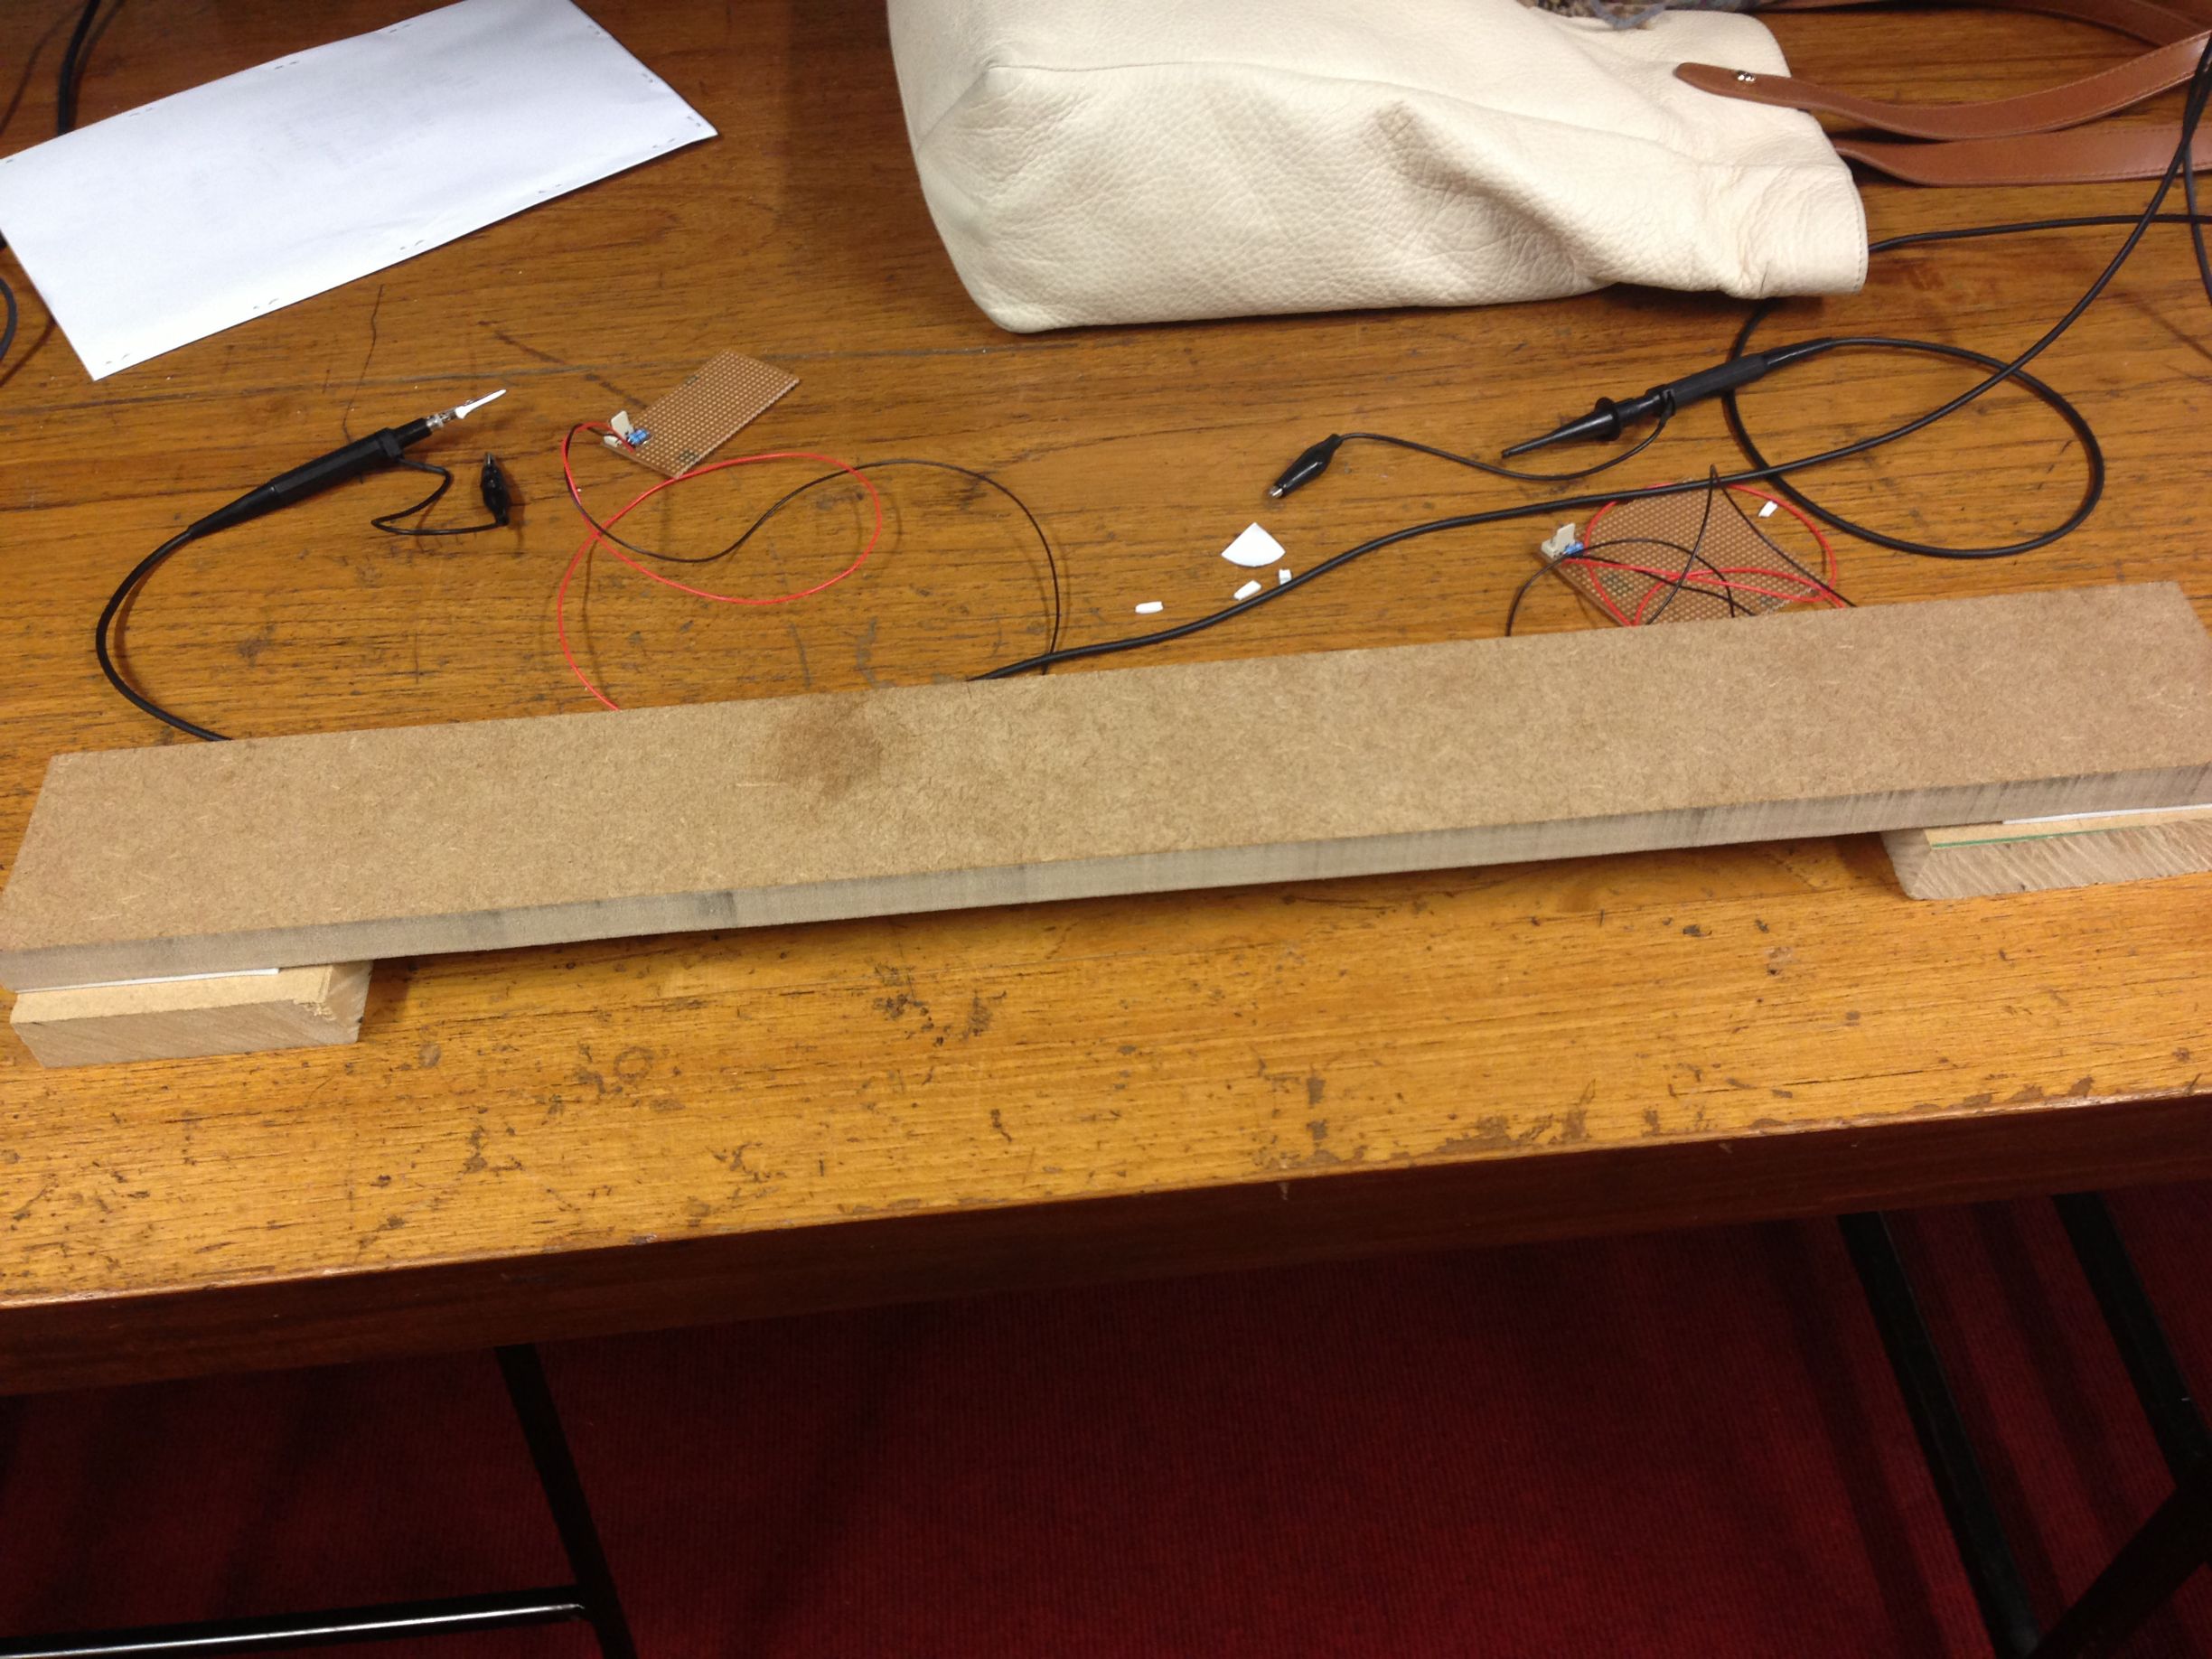
After attaching the 5p to the centre, a piece of foam was cut to cover the rest of the sensor. This is shown in ***. The completed sensor was then covered with the shorter block of MDF. This also acts as a leg of the balance board. The other sensor was attached in the same way to the other side of the long MDF.
 |
 |
| Foam shape cutout | Completed Drum Pad board |
Sensor Circuit & Diagram
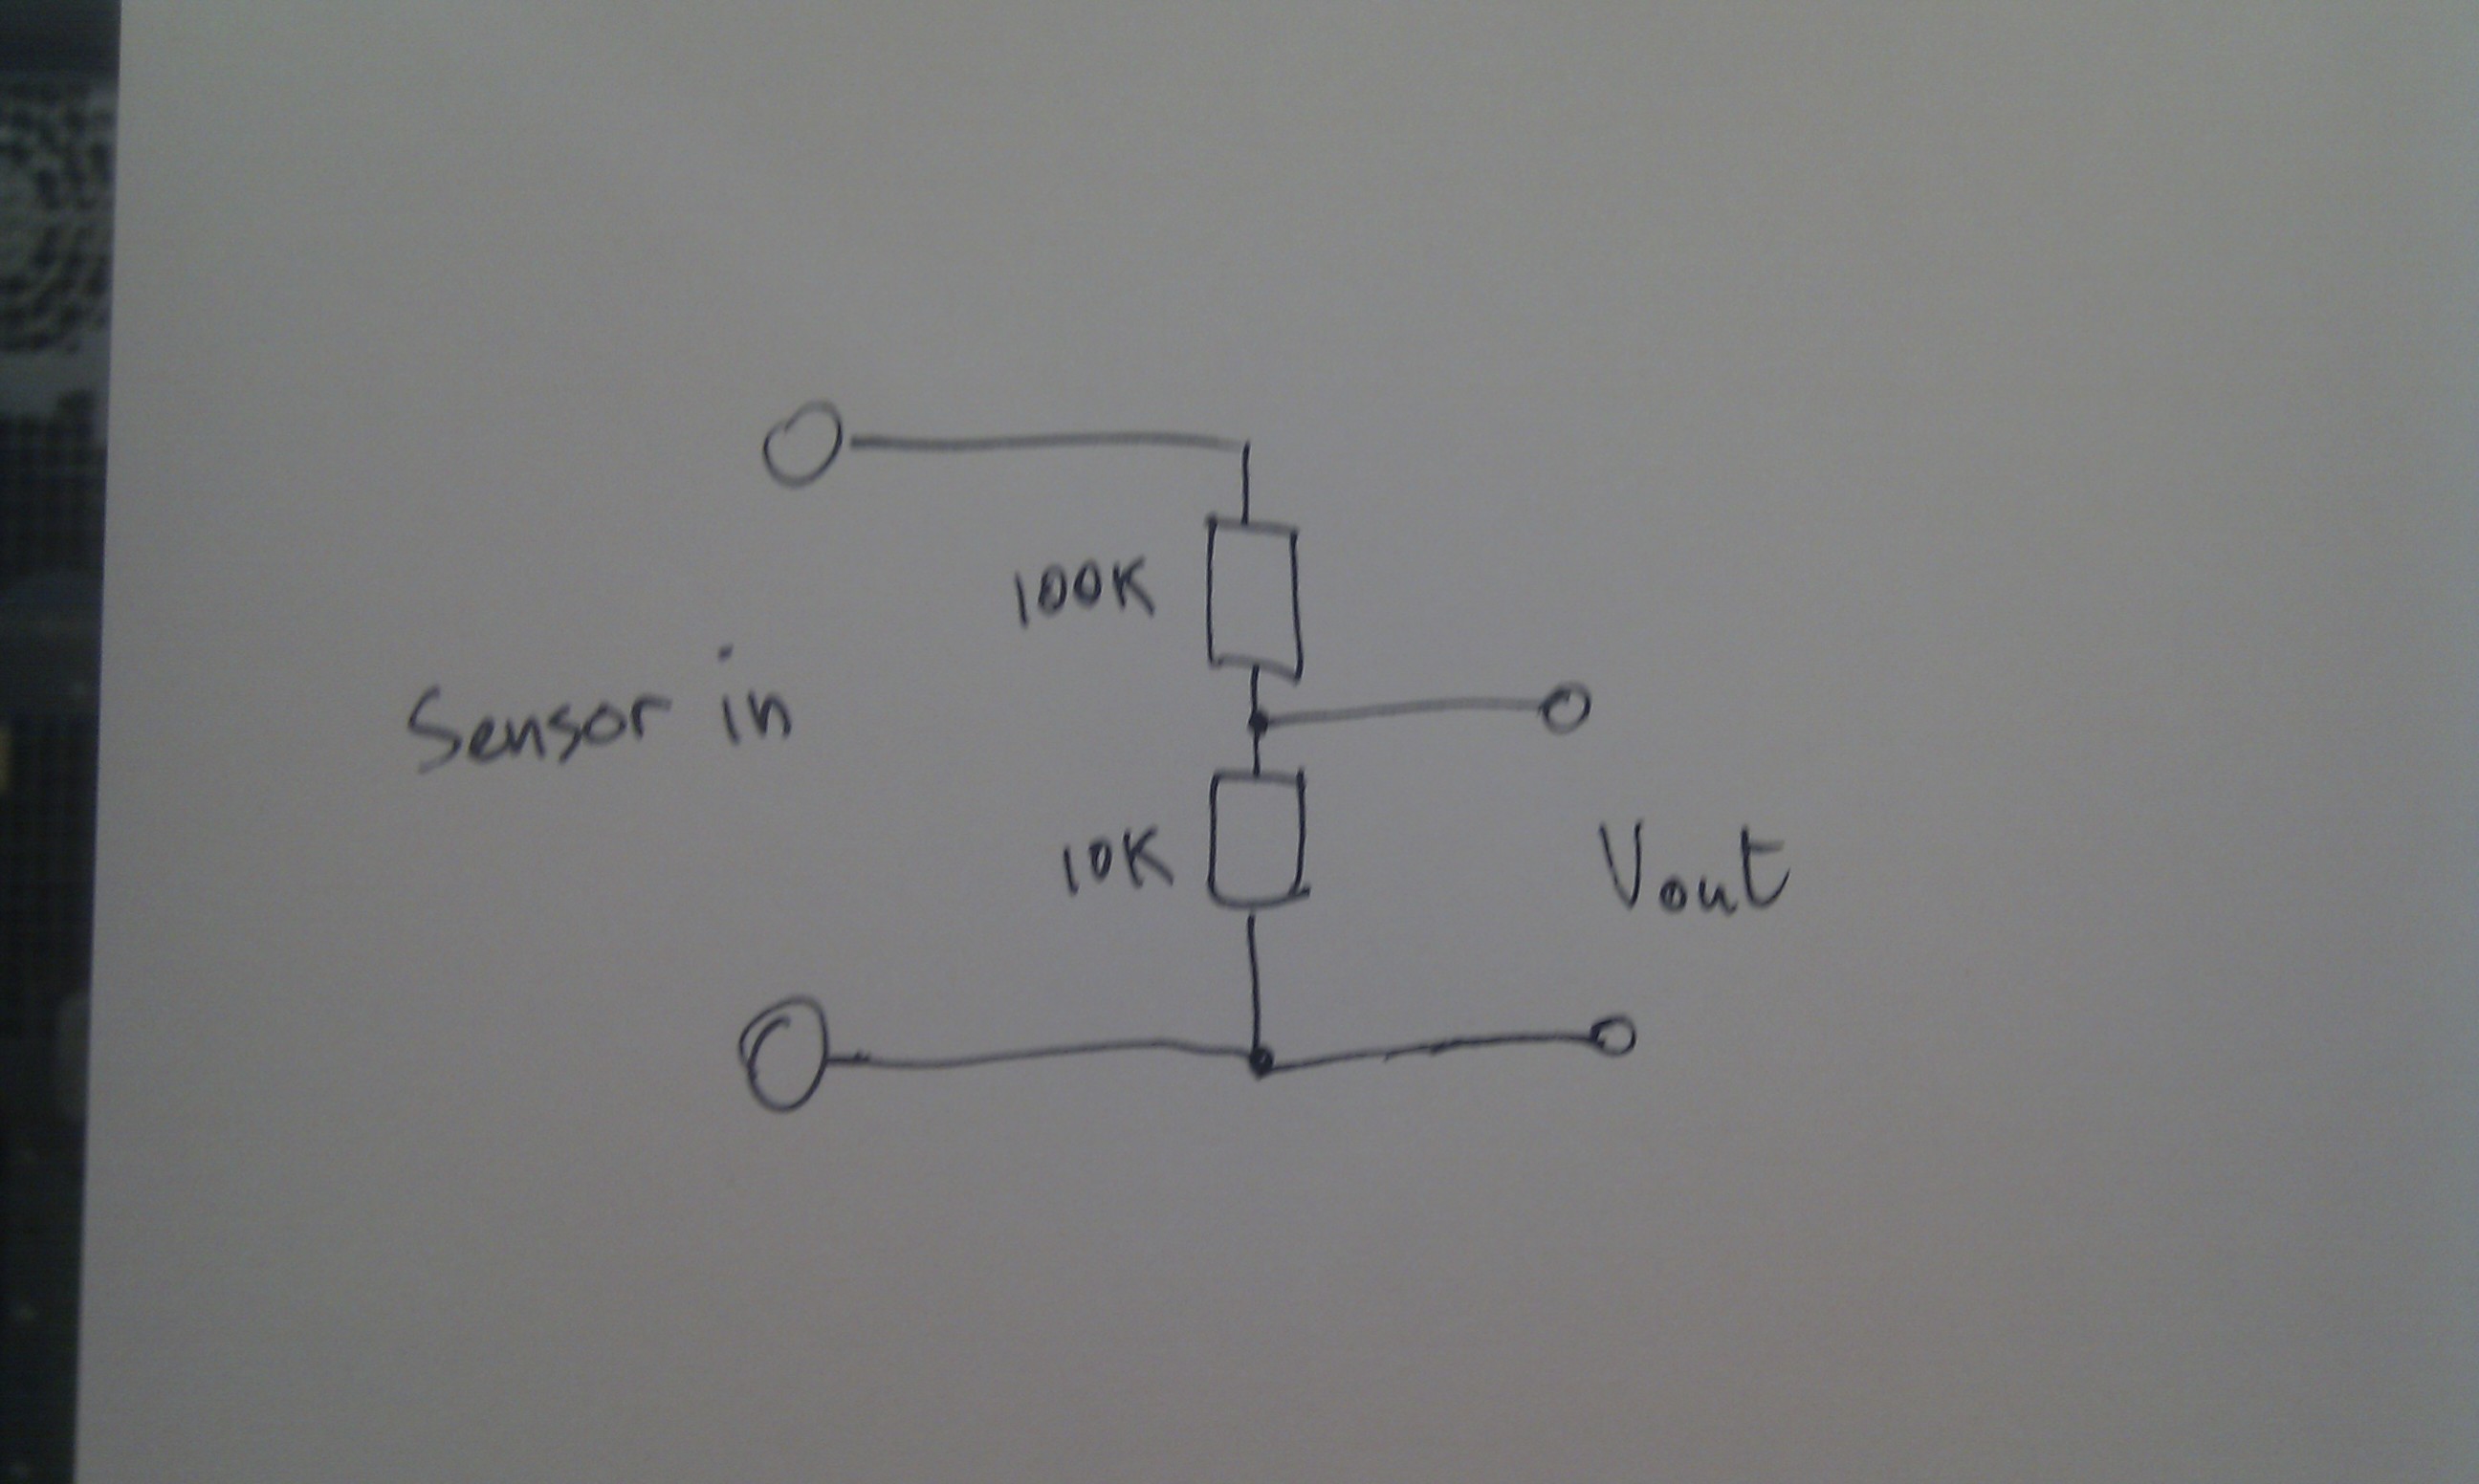
When first testing the board, it was found that the piezo could output up to 50V. This was far too high to be used as an input to a GPIO pin, so a simple voltage divider circuit was constructed in order to reduce the voltage. The schematic shown below consists of 10k and 100k resistors connected in series.
 |
| Circuit Diagram |
After constructing this design on veroboard the voltage output was in the region of +/-1.5V. This was verified through the use of an oscilloscope to examine the output.
Software: Test the ADC
The team was provided with demonstration code that simply reads the input to Channel 1 of the ADC and prints the value. This is available from the git repository here. It is worthwhile using this program to test whether the ADC board has been constructed properly and is able to read in signals.
Software: The Final Code
The final code designed by the team is capable of reading from the ADC and plotting the results on a graph. It can be found in a git repository here.
Reading from the ADC- AD7705.cpp & AD7705.h
In order to read data values from either ADC, a class (AD7705) is defined with two functions: initChannel and read. The constants CHAN1 and CHAN2 are defined in AD7705.h, and can be used to initialise and read each channel.
initChannel: Takes either CHAN1 or CHAN2 as its input, and sets up the clock and setup registers to sample the selected channel at a rate of 50Hz.
read: Reads data from the channel input by carrying out two 8 bit reads and packing them into one 16 bit value.
Plotting the ADC Results: window.cpp & window.h
Once results have been obtained from the ADC, it is then possible to plot these using the QT library. The results will be shown via the HDMI interface on the Raspberry Pi Board.
The main body of this code is based around two loops - a fast one (executed every 5ms) to read ADC data and store it in a buffer, and a slow one (50ms) to display that data on the screen. The QT timers are not accurate below ~20ms, but the AD7705 could not read at faster that 50Hz anyway. The read loop typically executes once or twice per display.
Result
Here is a video showing the drum pad in action. You will see the sensor channel being switched half way through.
Conclusion
The outcome of the project is a dual-sensor drum pad that can be
used to measure pressure. Unfortunately, the AD7705 has problems
reading from both sensor channels simultaneously, so we elected to
only read one at a time. The datasheet is ambiguous with regards to
this, so a button was added to the GUI to switch between sensors.
An attempt was made to emulate reading two sensors simultaneously
by switching between them, but the switching action was too slow to
be useful.
The AD7705 is also unreliable if trying to sample at a rate above 50Hz, which is too slow to accurately measure drum hits. A future improvement would be to use a different ADC (or two) that is/are capable of sampling at a higher rate (~1kHz).
